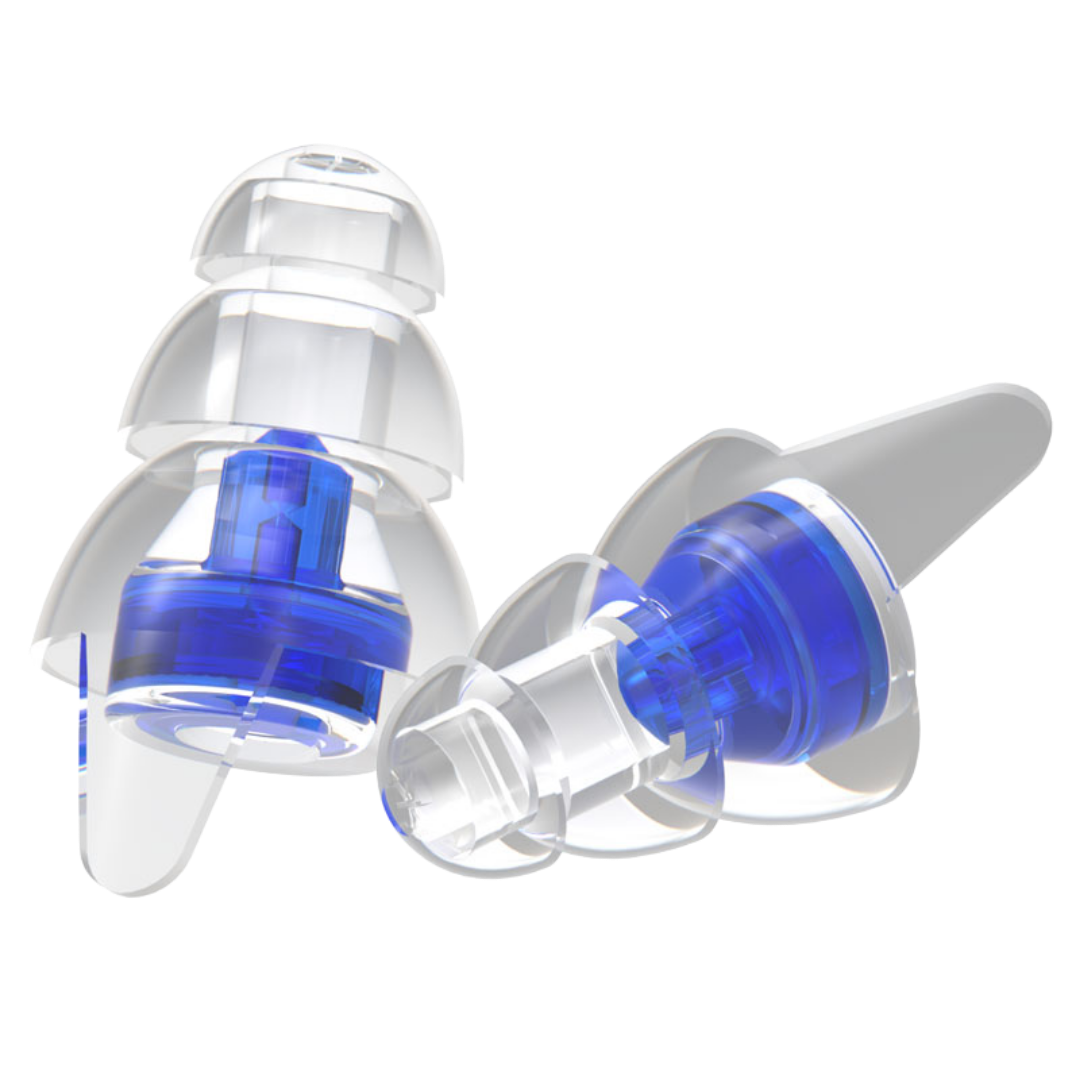
9:41
9:41
Chinese Grand Prix
-- dBA
Min --
Avg --
Max --
.5 1x 2 5
VIDEO PHOTO

Share the sound you captured

F1 Sound Pit

Here’s how to use the sound level meter, see your voice on the spectrogram, and try a blind test with five famous motors.

  • Start the sound level meter — Tap Sound Pit in the bottom bar (gauge icon). On the Soundmeter screen, tap the large centre button on the gauge so the app listens. The needle and dBA readout show how loud it is.
  • Record your voice on the spectrogram — Tap the microphone in the row under the 3D spectrogram and allow access if asked. Speak or sing: your voice drives the colourful 3D spectrogram above.
  • Blind test — five motors — Use the five team buttons (Ferrari, Mercedes, Red Bull, Audi, Honda) to play engine clips. Listen without peeking at labels if you like, then tap the brand you think matches the sound. Replay any clip as many times as you want before you decide.

F1 Sound Pit

This tool measures sound level (A-weighted) and tracks your exposure during an F1 weekend. It is for awareness only and is not a substitute for a calibrated sound level meter or medical advice.

Prolonged exposure above 85 dBA can harm hearing. At F1 events, levels often exceed 95 dBA near the track. Use earplugs or earmuffs when appropriate.

Consult a doctor if you have hearing concerns. By continuing, you accept this disclaimer.

F1 Sound Pit

Share the sound of the cars you love

This story is hosted on Canva and can’t be shown inside the app.

Created with F1 Sound Pit

Open in new tab
F1 Sound Pit
Safe
AVG
--
-- dBA
MAX
--

Blind Test 2026 Formula 1

    Drag a logo from the bottom to the glowing car

    Drag onto a car slot, or tap the slot after the logo. On a phone, drag with your finger and release on the slot.

    Car 1
    Car 2
    Car 3
    Car 4
    Car 5

    MY MEASUREMENT SESSIONS

      No sessions yet. Use the Meter to record.

      Sound Map of the Singapore Formula 1 Circuit

      Measurements can be shared with the community to produce participatory noise maps (inspired by NoiseCapture / OnoMap).

      LAeq dB(A)
      >105
      100-105
      95-100
      90-95
      85-90
      80-85
      75-80
      70-75
      65-70
      60-65
      55-60
      MAP LAYER
      DATA

      Hexagons show noise levels. With 0 measurements, enable "Community sound level" to see example data. Zoom in for finer hexagons. "Live simulation" shows two cars racing; enable "Community sound level" to see the color map from 500 simulated users recording—hot spots follow the cars. Record with location to see your own data here.

      Formula 1 Events

      Choose a Grand Prix to view the circuit and expected sound levels.

      Next Round 2 China 13 – 15 Mar
      Upcoming Round 3 Japan 27 – 29 Mar
      Upcoming Round 4 Bahrain 10 – 12 Apr

      Circuit Sound Map

      Click a grandstand on the map to see details.

      Circuit map with grandstand zones. Click a grandstand to see details.
      60 dBA 110 dBA

      Safe Exposure Time

      Choose your ear protection

      −15 dB earplug
      −20 dB earplug
      0 dB
      −15 dB
      −20 dB
      Protection
      97dBA
      82dBA
      77dBA
      Average Noise Level
      30 min
      4h
      8h
      Safe Exposure
      0 min2h4h6h8h

      Circuit sound levels

      Click a grandstand on the map to see noise levels and safe exposure for that area.

      Use the Meter during the weekend to track your exposure.

      Protect Your Hearing

      Safe listening

      ?

      Of an 8 h NIOSH-style limit (85 dBA criterion) while the meter runs.

      100%

      Remaining

      Select a Grand Prix to view the circuit and select your position for sound levels.

      Next Round 2 China 13 – 15 Mar
      Upcoming Round 3 Japan 27 – 29 Mar
      Upcoming Round 4 Bahrain 10 – 12 Apr

      Select your position

      Tap a grandstand on the map to see sound level and ear protection for that location.

      Shanghai circuit with grandstand zones. Click a grandstand to set exposure level.
      60 dBA 110 dBA

      Safe Exposure Time

      Choose your ear protection

      −15 dB
      −20 dB
      0 dB
      −15 dB −20 dB
      Protection
      97dBA
      82dBA 77dBA
      Average Noise Level
      30 min
      4h 8h
      Safe Exposure
      0 min2h4h6h8h
      15 dB Pack earplugs −15 dB

      15 dB Pack

      Light attenuation for conversation and awareness. Ideal for F1 paddock and moderate noise.

      €29

      Buy now
      20 dB Pack earplugs −20 dB

      20 dB Pack

      Stronger reduction for grandstands and pit lane. European SNR ~20 dB.

      €34

      Buy now

      Your cart

        You will complete your order on our partner’s secure site.

        Home
        Sound Pit
        Ear Protection
        What is a Soundmeter?

        A soundmeter is a specialized device used to measure noise exposure over a period of time, typically an 8-hour working day.

        It helps ensure compliance with health and safety regulations, such as those from OSHA (Occupational Safety and Health Administration), the Occupational Noise Exposure Standard, or the EU Directive 2003/10/EC.

        The soundmeter calculates the noise dose as a percentage of the allowable exposure limit (e.g., 100% dose means the exposure has reached the maximum safe limit for an 8-hour day).

        TWA (Time Weighted Average): This is the average sound level over a period, normalized to an 8-hour working day. Exposures at or above 100% are considered hazardous.